
AWS Daily Cost Report
Our AWS Daily Cost report is our main feature to help you monitor your AWS cost, AWS Reserved Instances + Saving Plan utilization and expiration.
Within less 30 seconds, the report will let you know if your AWS cost needs your attention right in the subject line or you can move on your day and focus on other technical priorities.
All our subscription plan includes one AWS daily cost report that summarizes your cost. For our Growth and Enterprise plan, you can create additional cost reports and slice/dice your cost by tags and/or sub-accounts.
Below is a run through of how to view and read our Daily AWS Cost Reports and it’s different sections. With our cost reports, we go with a top down approach, giving you broader and summary details of your cost on top and more granular detail as you scroll down:
- Subject Line
- “Todays” spend
- Forecast \ Cost Anamoly Alerts
- Daily Usage
- Monthly Data
- Reserved Instances and Savings Plan monitoring
- Products \ Regions \ Tags \ Sub-accounts graphs
Click Here To See a Full Sample Email Cost Report
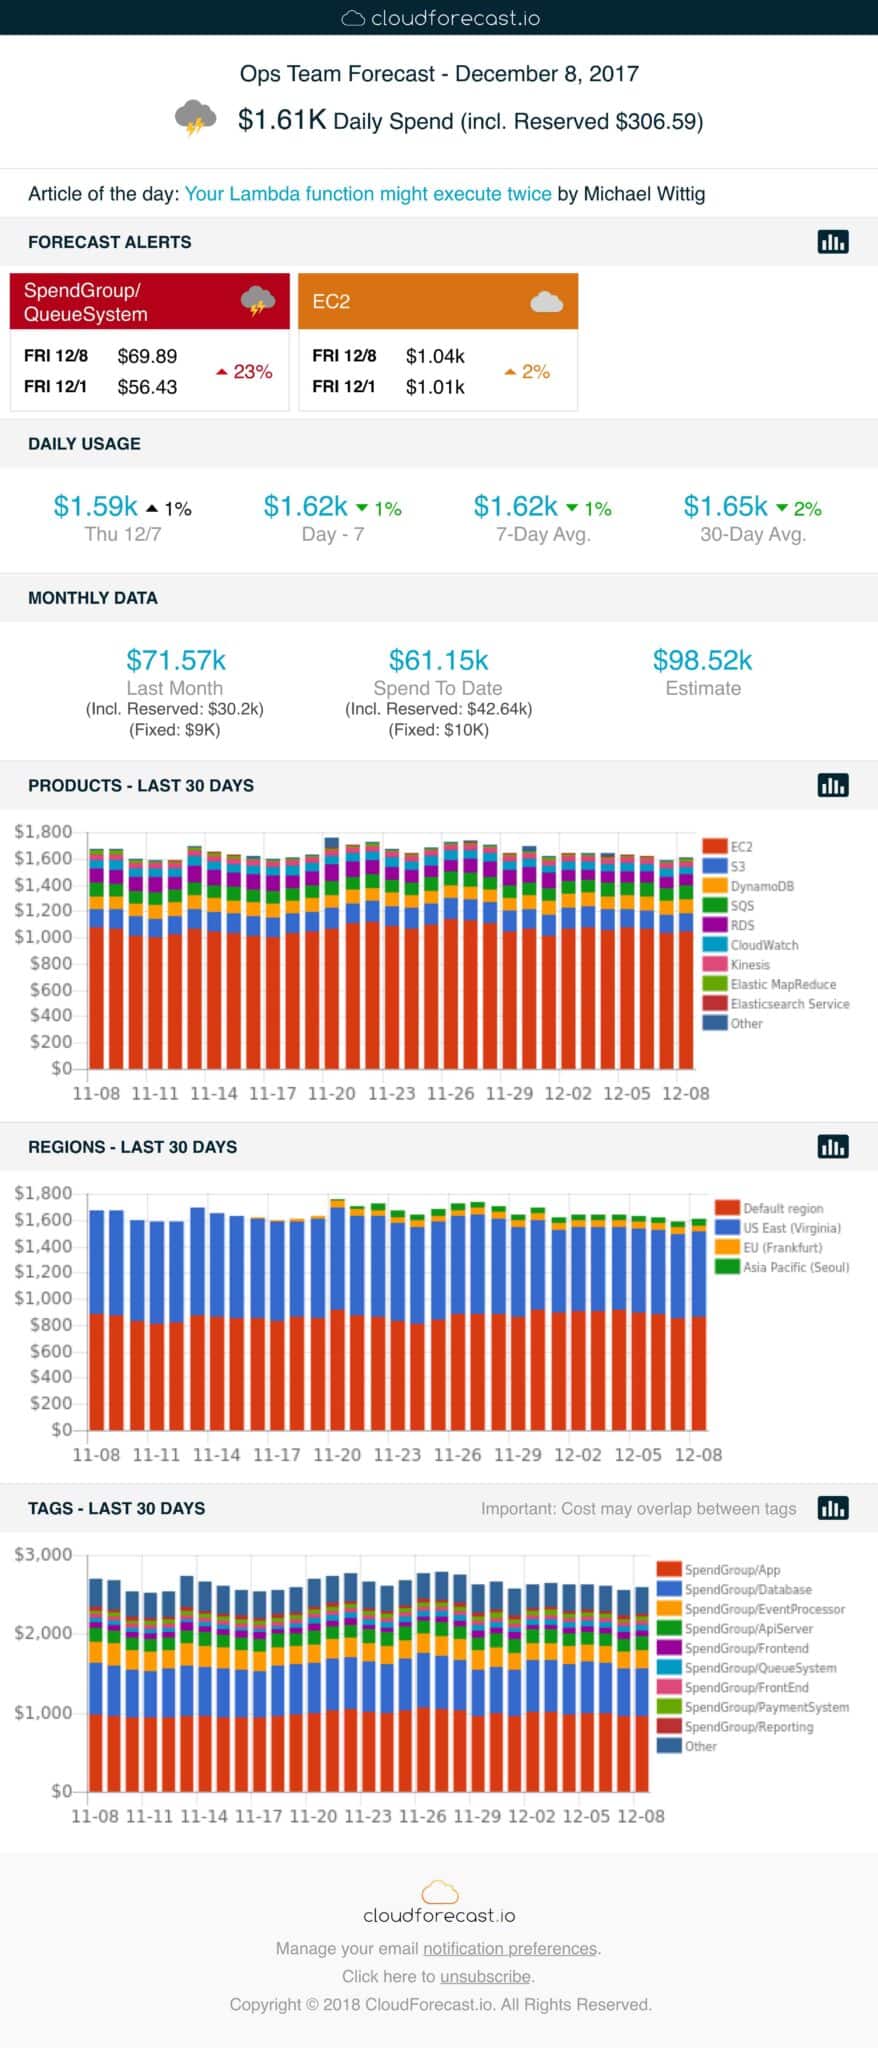
Subject Line
The subject line is the first area you’ll see and notice when our daily cost reports arrive. This is where our application will alert you of any cost anamolies through a set of emojis. If it’s sunny, that means the cost has relatively flat and you archive and not worry about your cost. However, if it’s cloudy or stormy, you should open up the cost report to dive in further to see what areas are triggering the thresholds.
The thresholds can be defined by you and is completely customizeable with how you or you would like your team to be alerted. To learn more about editing your cost report based on your use case, visit our documentation about our app.
Todays Spend
Right on top of the daily cost report is the day’s spend we are reporting on and the emoji associated for that day. By default, the day’s cost is comparing to the day before. This is configurable in our app and you can also compare week over week or last 7day average.
Since AWS CUR files is always reporting your cost the day after and can take up to 24 hours to finalize, we send our cost reports as soon as we can determine that AWS has finalized cost for that day.

Note: AWS can often be late with providing us the latest CUR files.
Forecast Alerts (AWS Cost Anamoly Alerts)
If there are any cost increases within your environment, we alert you of those areas with the comparison numbers and the percantage of increases with these cards.
You’ll get cost anamoly alerts for any total spend, product, region, tag or sub-account cost increases as well. These thresholds are configurable in our app and can be adjusted to how often you would like to receive these alerts.

Daily Usage
The daily usage section is purely total cost numbers and comparing different date ranges for the day spend. This will give you an idea with how your day’s cost is trending and report on the total cost in addition to the percentage of difference. The daily usage area will give you comparison of your cost for the following:
- Day before
- Week over Week
- 7-day average
- 30-day average

Monthly Data
The Monthly data gives you a wider picture with how your cost is trending for the total month. The Monthly Data will give you cost information for the following:
- Last Month Cost
- Month to Date Cost
- Estimate for the end of the month
In addition to these, we also break out fixed cost that are part of your total cost. That way you can get full seperation of visibility of one-time fixed cost vs possible variable cost:
- Reserved Instances Cost
- Savings Plan Cost
- Fixed Cost (any one-time cost)
- Taxes

AWS Reserved Instances and AWS Savings Plan (Growth and Enterprise)
The AWS Reserved Instances and AWS Saving Plan shows your overall utilization and any upcoming expiration <90 days across the following. This section helps your team ensure they are getting the most out of your Reserved Instances and Saving Plans purchases and not be caught by an upcoming expiration.
We provide a direct link to these purchases in the AWS Console so you can dig in further if you need to. For any expirations, we’ll always list them out be descending order by expiration date and give you the following information:
- Expires in XX days
- Instance type
- Region
- Instance number

Product / Region / Tags / Sub-accounts graphs
The Product / Region / Tag and Sub-accounts graphs will display your top 10 cost in these areas and gives you a quick visual way to see trends with your cost in these areas.

There is also an externally linked graph where you can. The externally linked graphs can be shareable via a private linked graph (similar to google docs) but the setting must be enabled in Applicatin/Settings/AWS Credentials.