Exploring CUR Integrations and Advanced CUR Topics
Now that we’ve covered the basics of the AWS CUR, how to set it up, and its various limitations, the logical next step is to explore different CUR integrations and other advanced topics. After all, this is how you’re going to squeeze the most value out of your CUR.
In this section, we’ll take a closer look at the following topics:
- Cost Analytics – Native CUR Integrations
- Deep Dive into CUR Columns
- Cost Allocation Tags
- CloudForecast.io
Cost Analytics – Native CUR Integrations
The data in your CUR is like an untapped gold mine: full of potential, but not particularly valuable until you extract and process it! This is where the CUR’s 3 native integrations come into play. By hooking up your CUR with Athena, Quicksight, or Redshift, you can gain more insights and create data visualizations, all from within the AWS ecosystem.
While this all sounds amazing, the CUR forces you to choose one of the three services to integrate with during the initial setup. While you can change this later on, it’s best to choose correctly the first time since the format of your CUR can differ based on which integration you pick. This can be extremely awkward for new CUR users that are unfamiliar with these services. If this is you, fear not because we’re now going to explore each of these integrations with Athena, Quicksight, and Redshift.
CUR Integration with Athena
Amazon Athena is a data querying service that’s great for large-scale use cases, CUR files included. Think of Athena as the “engine” you use to run SQL queries on columns in your CUR file. It’s completely serverless, you only pay for the queries that you run, and Athena is able to return results in seconds.
Note that Athena is only responsible for running your queries. This means that the results you get won’t immediately be useful from a data analytics perspective. You’ll probably have to build additional BI applications based on your query results. Still, because the types of SQL queries you can run are effectively boundless, a CUR integration with Athena is extremely flexible.
To get a sense of the types of queries you can run, head over to AWS Well-Architectured Labs for some inspiration. In particular, you can write queries that isolate costs related to EC2 usage, figure out which of your ELBs are idle, and track spend on serverless products only (useful for tracking serverless product adoption across teams), just to name a few. To get started with a CUR integration with Athena, refer to the AWS documentation.
CUR Integration with Quicksight
Amazon Quicksight is a business intelligence service that focuses on helping you create visualizations and dashboards for your CUR data. When setting up the integration, all you need to do is upload your CUR manifest file into Quicksight, and all columns and data from that file will be available for creating custom charts and graphs.
Among the three integrations, Quicksight has the smallest learning curve. Unlike Athena, which requires domain knowledge of SQL, Quicksight features a drag-and-drop interface so anyone can use it to create professional-looking dashboards.
To see Quicksight in action, we turn again to AWS Well-Architectured Labs for inspiration. The lab walks you through creating a graph to visualize cost by account and product, and cost by line item description. AWS documentation on CUR integrations with Quicksight is sparse, so we recommend the lab for getting started.
CUR Integration with Redshift
Amazon Redshift is a data warehouse where you can store and analyze large-scale data. Since Redshift is a data warehouse, you’ll have to load in your data into your Redshift cluster first, as opposed to the Athena integration where you can query the CUR file directly in S3.
The advantage of Redshift is that it contains backend optimizations to make querying more efficient. This makes it a great choice if you plan on running frequent queries. At the same time, you’d probably incur higher charges using Redshift since it’s not serverless: you’ll need to pay for data storage in addition to compute.
Since Redshift also works with SQL queries, the examples from AWS Well-Architectured Labs for Athena also apply for Redshift. This is a great place to get started with a Redshift integration.
Summary
Here’s a table summarizing the three integrations:
| Topic | Athena | Quicksight | Redshift |
| Service summary | Serverless, data querying service that supports SQL | Serverless, BI service for creating visualizations and dashboards | Non-serverless, data warehouse service |
| Main capability | Run queries on the CUR as-is (stored in S3) | Create data visualizations for CUR data | Run queries on CUR data loaded into Redshift cluster |
| When/why choose this service? | Good for SQL SMEs, lower cost, better choice for infrequent querying | Beginner-friendly option, good choice for generating graphs quickly | Good for SQL SMEs, higher cost, better choice for frequent querying |
Deep Dive into CUR Columns
Becoming fluent in CUR-speak is what distinguishes a CUR expert from a newbie. With so many columns in a CUR file, you’ll want to focus your attention on just the ones that are most important to you. For starters, this may include:
- LineItem/UsageStartDate – The start date of the usage period for the current line item.
- LineItem/UsageEndDate – The end date for the usage period for the current line item. Together with LineItem/UsageStartDate, these are crucial for writing SQL queries that focus on a particular time window.
- LineItem/UnblendedCost – The total cost for this line item charged based on direct usage.
- LineItem/BlendedCost – The averaged cost for this line item across all member accounts of an organization. Unblended vs. Blended costs is a common source of confusion among newer CUR users.
- LineItem/ResourceId – The resource ID. Only included if you enable individual resource IDs in your report. Each AWS service may refer to a different resource identifier, summarized in this table in the AWS documentation.
Of course, there are a wealth of other columns that might be crucial to you. Anything in the data dictionary is fair game! For example, if you’re on a Savings Plan, pay special attention to the savingsPlan/ columns.
Cost Allocation Tags
Cost allocation tags are a special breed of tags. They help you categorize resources based on how you want them billed, which may or may not be the same as how you manage and organize them regularly (i.e. with plain-old resource tags). This is the main distinction between cost allocation tags and regular tags.
Your CUR file displays cost allocation tags only. Cost allocation tags come in two flavors: AWS-generated, and user-defined.
- There is just one AWS-generated tag: aws:createdBy, which contains information about who created the resource. Fields within this tag include account-type and account-id.
- User-defined tags are more interesting: you can create whatever tags you want that make the most sense in allocating your costs. Tags that you create have the user: prefix.
For both of these types of tags, you must activate them in order for them to start showing up in the CUR as resourceTags/ columns. Creating effective cost allocation tags can be a gamechanger in helping you make the most sense of your costs.
CloudForecast.io
And finally, if you’re tired of all this CUR business, you may want to give CloudForecast a spin. Rather than having to sift through columns and run complex queries all day, CloudForecast provides a central cloud monitoring and cost optimization platform that makes tracking costs easy.
Remember all the downsides to the CUR that we covered in the last section? CloudForecast addresses these pain points with the following core features:
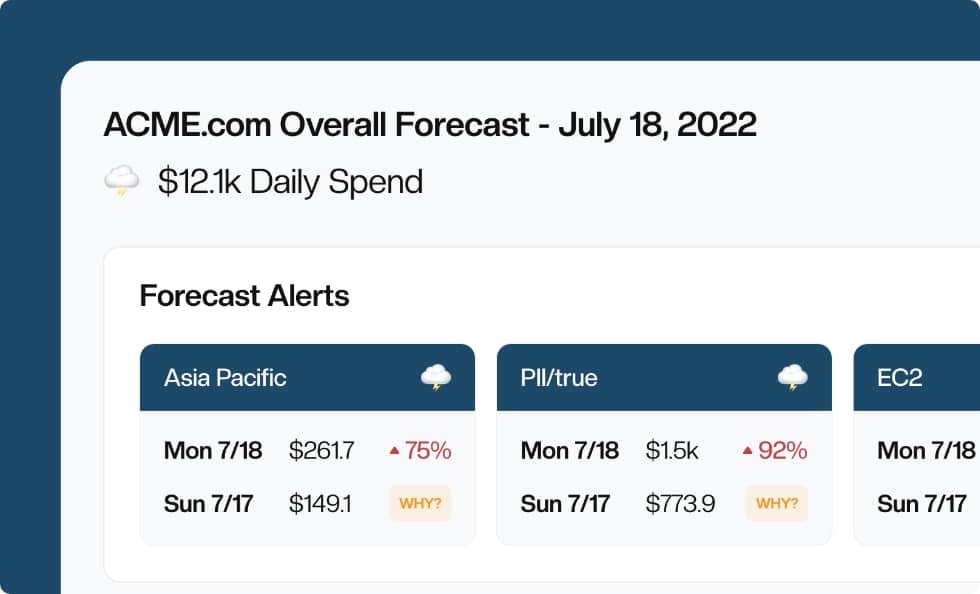
- Visual dashboards – Right out of the box, CloudForecast takes your CUR and produces easy-to-read visual spending reports out of it. Why interpret your CUR yourself when CloudForecast can do it for you?
- Cost anomaly detection – CloudForecast lets you view all your AWS resources in a central platform. For each resource, you can monitor the overall cost, usage, and performance, making it easy to detect anomalies early.
- Custom dashboards – CloudForecast generates a daily spending report highlighting the most important cost information, but what if you wanted more? Good news: you also get the ability to customize dashboards to share with your stakeholders.
Overall, CloudForecast can be an invaluable tool in helping your organization both understand your costs and figure out avenues for cost optimization.
Conclusion
Whew! We’ve just steamrolled through a lot of content on the CUR–props to you for making it through this far. Hopefully, this gave you a good overview of AWS Cost & Usage Reports, one of the most important offerings that many AWS users don’t use to their full potential.
In this article, we’ve covered everything from CUR basics to understanding its limitations. We walked through exactly how to set up your CUR from the AWS console if you haven’t done so already. Then, as a natural next step, we also looked at some important CUR integrations and in-depth topics to dive into next.
Though we’re at the end of this article, your CUR journey should not and cannot end here. Remember that as your organization grows, so will your costs, so taking steps to proactively understand the CUR is crucial to do sooner rather than later. Or, feel free to delegate that piece to CloudForecast and they’ll make sure you’re in good hands.
Manage, track, and report your AWS spending in seconds — not hours
CloudForecast’s focused daily AWS cost monitoring reports to help busy engineering teams understand their AWS costs, rapidly respond to any overspends, and promote opportunities to save costs.
Monitor & Manage AWS Cost in Seconds — Not Hours
CloudForecast makes the tedious work of AWS cost monitoring less tedious.
AWS cost management is easy with CloudForecast
We would love to learn more about the problems you are facing around AWS cost. Connect with us directly and we’ll schedule a time to chat!
