Using Amazon Redshift With Cost and Usage Reports (CUR)
Enabling Cost and Usage Reports (CUR) is a critical first step in helping you understand your AWS spending. Not only will the CUR tell you how you’re utilizing your AWS resources, but it can also identify areas to optimize costs. If you haven’t already, refer to our Ultimate Guide to the AWS Cost and Usage Report to start having CUR reports automatically delivered to your account.
Immediately, you’ll notice one thing: the CUR is extremely large and clunky. Even if you’re able to open it in Excel, no pair of eyes is going to make much sense out of the dozens of columns and thousands of rows. To handle a beast like the CUR, you need to utilize one of the CUR’s native integrations with other AWS services.
Amazon Redshift is one such integration that can unlock the CUR’s full potential. Redshift is a data warehouse designed to handle large-scale analytics, so it can execute complex queries on your CUR data and more. While setting up a Redshift integration is a little more involved, it also carries the biggest potential returns. We’ll discuss why in this article, and show you how to set everything up step-by-step in the AWS console.
What is Amazon Redshift?
Unlike the other two possible integrations (Athena and QuickSight), Amazon Redshift is a data warehouse. This means the following:
- You can store CUR data in Redshift. Rather than leave your CUR as a CSV in the S3 data lake, you can import it directly into Redshift. This makes it readily available for analysis.
- You can query on CUR data in Redshift. After importing your CUR data, you can leverage Redshift’s querying capabilities to perform in-depth analyses.
- You can combine your CUR with other relevant datasets. Data warehouses are perfect for merging related datasets and analyzing them in combinations.
You should definitely choose the Redshift integration if you want to have your CUR data stored in a place such that you can perform queries on it. In addition, if you have other relevant datasets that would be useful to analyze alongside the CUR, the Redshift integration can allow you to load them all into the same cluster for analysis.
On the other hand, you might want to choose the Athena integration if you’re just looking to perform one-off queries on your CUR data. It’s a tad easier to set up, and we outline all of this in our CUR-Athena integration guide. Additionally, if producing business intelligence (BI) visuals is your main goal, we’d recommend choosing the QuickSight integration instead – our CUR QuickSight guide covers all that.
Step-By-Step: How To Integrate Your CUR With Amazon Redshift
You’re still here, so presumably you’ve decided Redshift is the right integration! To get started: first head over to the Billing console. Ensure that your CUR (new or existing) lists Amazon Redshift as the target integration under Report data integration:
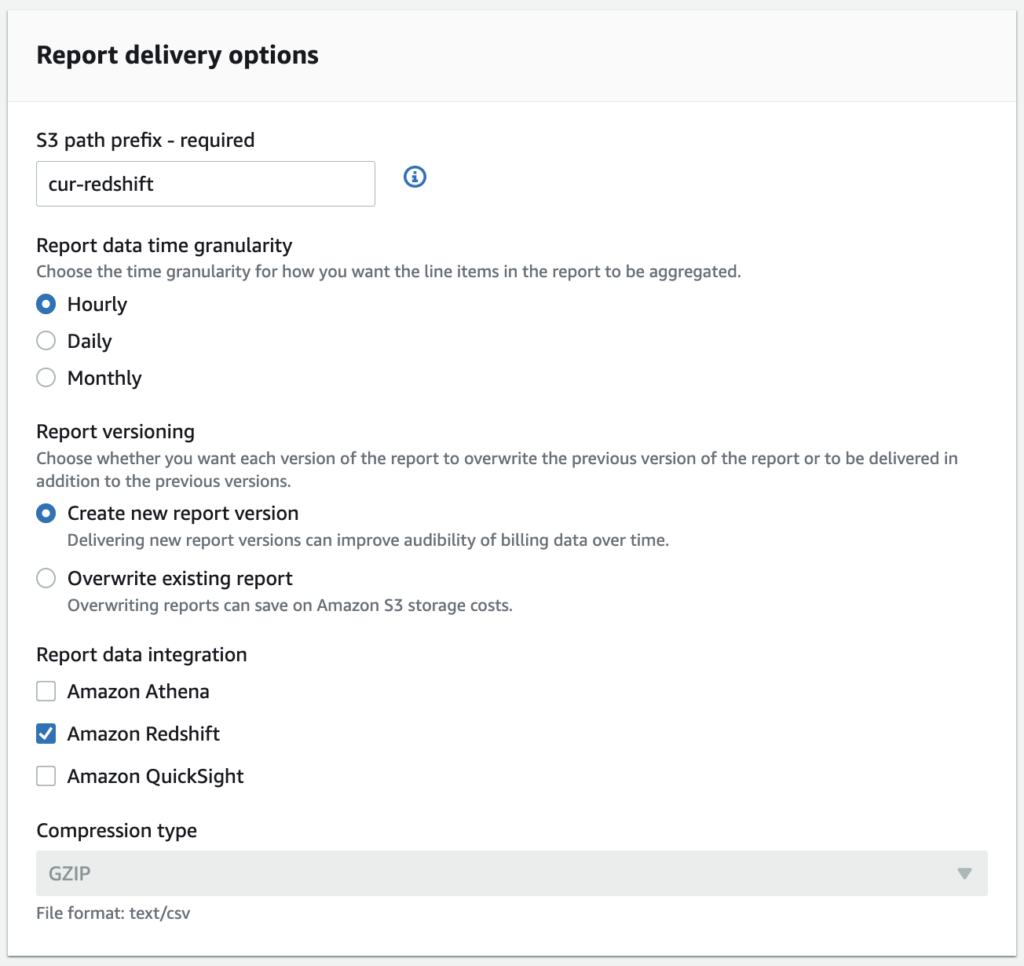
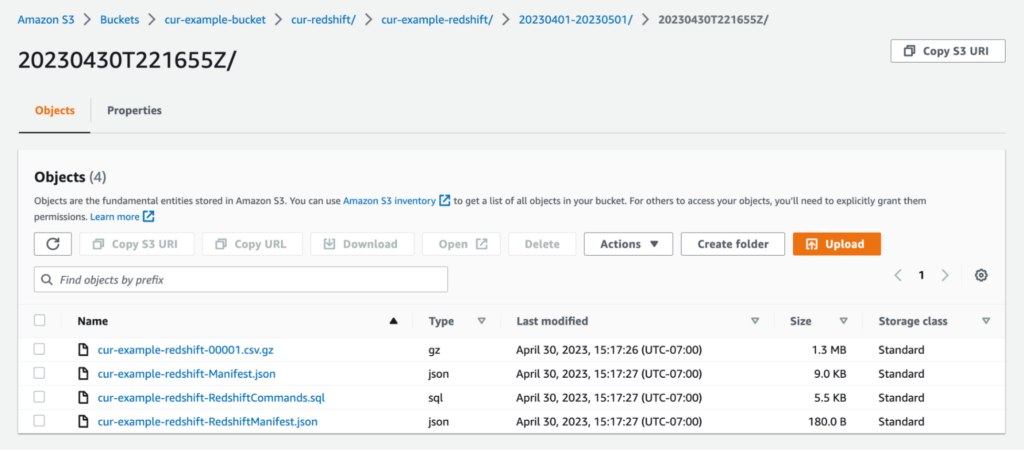
When you pick Redshift as your integration, AWS automatically uses the CSV format for your CUR files, and compresses them using GZIP. For each “serving” of CSV files that AWS gives you, you’ll also see three additional files:
- Manifest.json: Contains metadata related to your CUR. Largely irrelevant for this tutorial.
- RedshiftCommands.sql: Contains useful commands to help you perform tasks like creating a table in Redshift from your CUR data.
- RedshiftManifest.json: Manifest file that specifies which files Redshift should load file from. See AWS Docs for more on Redshift manifest files.
Altogether, it should look something like the following (note that it can take up to 24 hours for AWS to deliver your first report):
Once you start getting these files, your setup on the CUR side is done.
Setting Up Your Redshift Cluster
Assuming you’re setting this up from scratch, you don’t have a Redshift cluster yet, so let’s create one now. In the Redshift console, choose Create cluster, and create a cluster with the following configuration:
- Cluster identifier: cur-redshift-cluster
- Choose the size of the cluster: I’ll choose
- Node type: dc2.large
- Number of nodes: 1
- Admin user name: awsuser
- Admin user password: <Choose any password>
- Under Associated IAM roles, choose Manage IAM roles, then choose Create IAM role. In the pop-up menu, choose Specific S3 buckets, and then choose the bucket where your CUR resides. Choose Create IAM role as default.
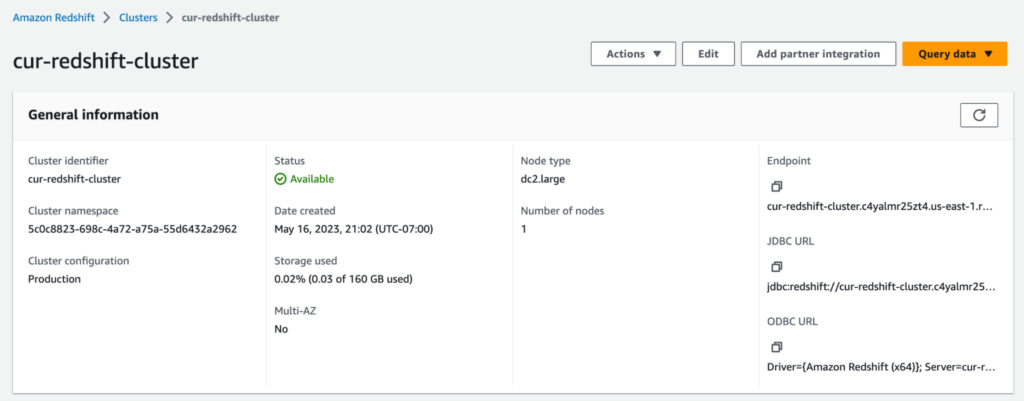
Choose Create cluster. It may take some time for Redshift to finish creating your cluster. Once you click into your cluster and see that its status is Available, you’re almost ready to do some querying!
Loading Your CUR Report Into Redshift
From the previous screenshot, choose the orange Query data button, then choose Query in query editor v2. This will open up a nice UI for you to interact with your cluster.
In another tab, open the S3 console. Navigate to a particular CUR report that you’d like to analyze. When you’re there, pay attention to the RedshiftCommands.sql file from before–it’s going to do a lot of the heavy lifting for us. Download the file and open it; it should be a collection of SQL commands.
Paste the first command (just line 1) into the Redshift query editor. This should be a very long CREATE command that essentially creates a new table in Redshift with the same columns as your CUR. Run it, and you should get a result that looks like this:

Awesome, table created. Now let’s populate it. The second command in the RedshiftCommands.sql file should be a COPY command that looks something like this:
COPY AWSBilling202304 from ‘’
	credentials ‘aws_iam_role=’
	region
You’ll have to replace the values of <AWS_ROLE> and <S3_BUCKET_REGION> with the IAM role ARN associated with your Redshift cluster, and the region of your S3 bucket respectively (note that you have to enclose the region value in quotes). Then, paste the command into the editor and run it. Redshift may take a while to run this, and eventually you should see a result like the following:
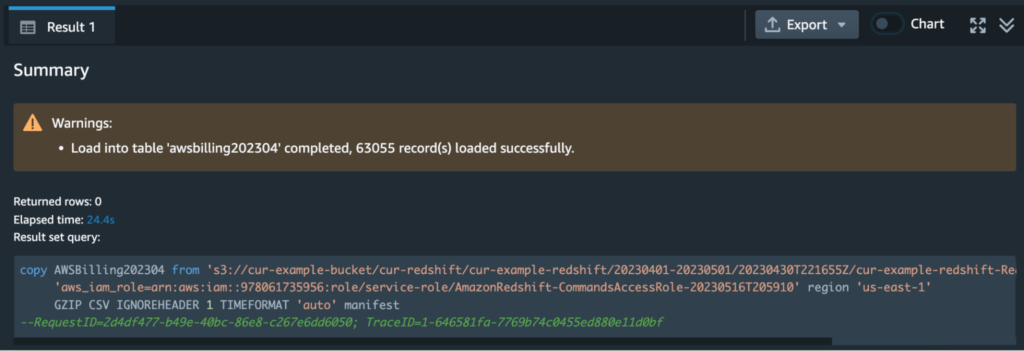
If you got this message then congrats–you’ve fully loaded your CUR data into Redshift!
Testing Your CUR Integration With Redshift
Now for the most fun part–testing our integration by writing some queries. First things first, a sanity check. Let’s make sure everything is working correctly with the following simple query:
SELECT * FROM AWSBilling202304
LIMIT 5
5 rows of your CUR report should appear in the result:

We can easily determine how much total spend we put on a specific service, say, EC2, with the following query:
SELECT SUM(cast(lineitem_unblendedcost as float))
FROM AWSBilling202304
WHERE lineitem_productcode='Amazon EC2';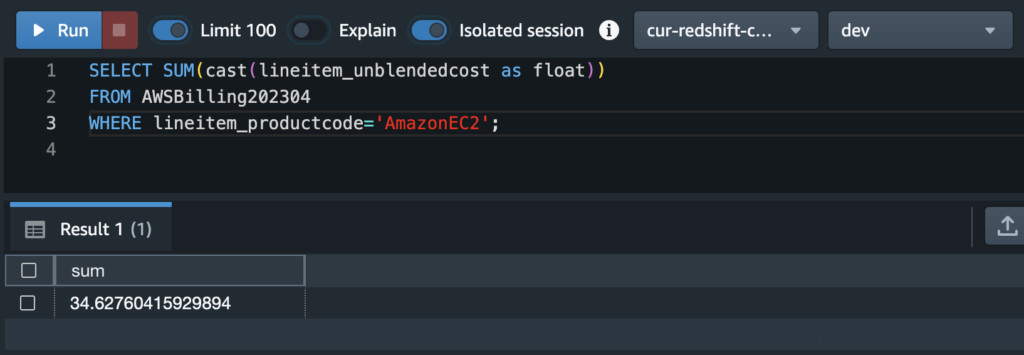
Or, we can take this a step further by listing the top 10 services by spending in decreasing order with the following query:
SELECT lineitem_productcode, SUM(cast(lineitem_unblendedcost as float)) as cost
FROM AWSBilling202304
GROUP BY lineitem_productcode
ORDER BY cost DESC
LIMIT 10;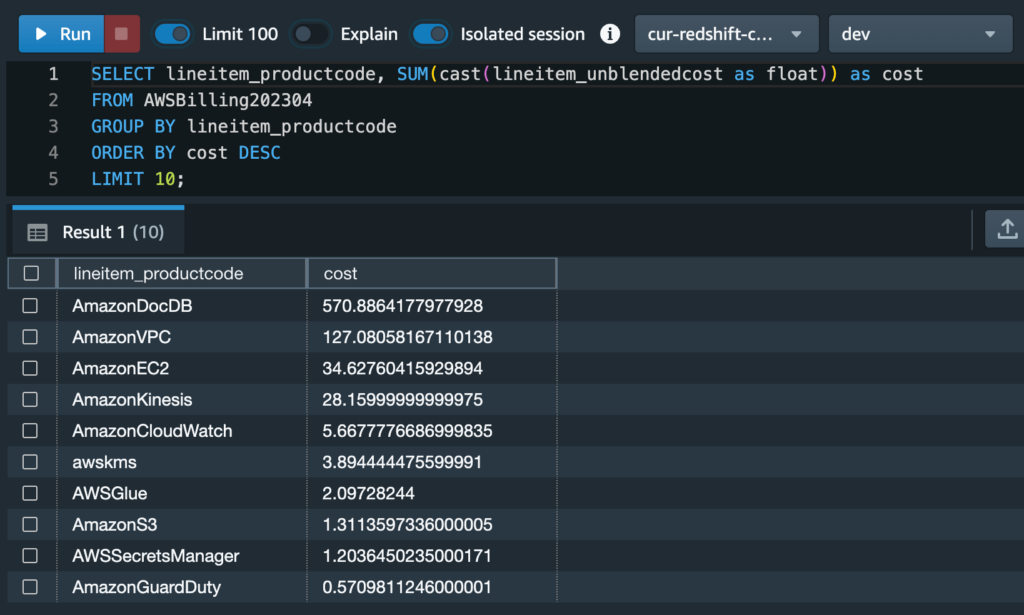
These are all simple queries–but don’t worry, there are plenty of ways to make this more complicated! For starters, you can reference the data dictionary to see the sheer amount of columns you have at your disposal in the CUR. However, we’d like to highlight an example using AWS cost allocation tags in the next section.
Using Cost Allocation Tags With Your Redshift Integration
Cost allocation tags let you customize how to group costs. Suppose you had a group of resources that are all part of an application codenamed Squirtle. Then, you might create a custom cost allocation tag, Squirtle, that you attach to each relevant resource. Further, you might define some possible values for this tag to further categorize costs, i.e. Data store or Compute.
The main benefit of going through this extra administrative hassle is that you now get a new column in your CUR dedicated to this cost allocation tag. In other words, you can write queries that show you only the costs related to a particular cost allocation tag (i.e. how much is the Squirtle application costing me?).
Let’s run through a quick demo on how to do this. If you have a cost allocation tag, you should see additional commands in your RedshiftCommands.sql file, starting from line 3 onwards. For example, since I enabled a couple of cost allocation tags (including Squirtle), I get the following commands in lines 3 through 7:
CREATE table AWSBilling202304_tagMapping (remappedUserTag VARCHAR(512), userTag VARCHAR(512));
INSERT into AWSBilling202304_tagMapping(remappedUserTag, userTag) values(‘userTag0’, ‘aws:cloudformation:stack-id’);
INSERT into AWSBilling202304_tagMapping(remappedUserTag, userTag) values(‘userTag1’, ‘aws:cloudformation:stack-name’);
INSERT into AWSBilling202304_tagMapping(remappedUserTag, userTag) values(‘userTag2’, ‘aws:createdBy’);
INSERT into AWSBilling202304_tagMapping(remappedUserTag, userTag) values(‘userTag3’, ‘user:Squirtle’);
Running this in the query editor, we get a result like this:
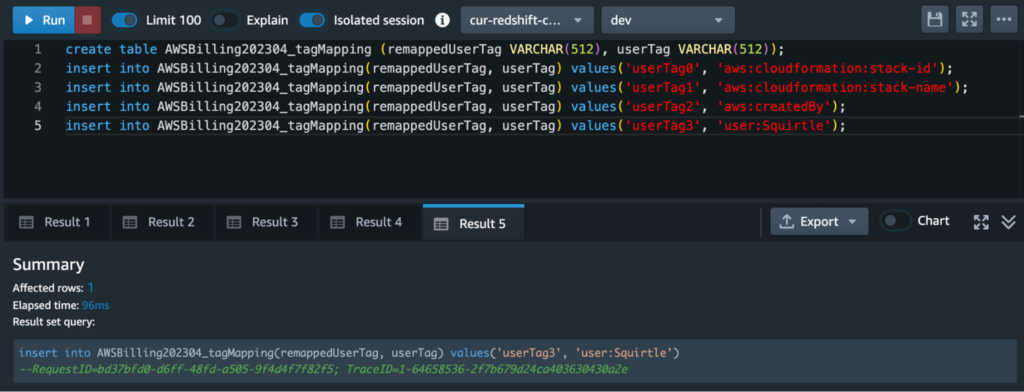
This is one of the interesting nuances of the Redshift integration. Redshift renames your cost allocation tags to userTag0, userTag1, userTag2, etc. in the main table. In order to not lose the original name of the tag, it uses a second mapping table, which we just created and populated. Later on, if we’re interested in finding out which column maps to the user:Squirtle tag, we can run the following query first:
SELECT remappedUserTag
FROM AWSBilling202304_tagMapping
WHERE userTag = ‘user:Squirtle’;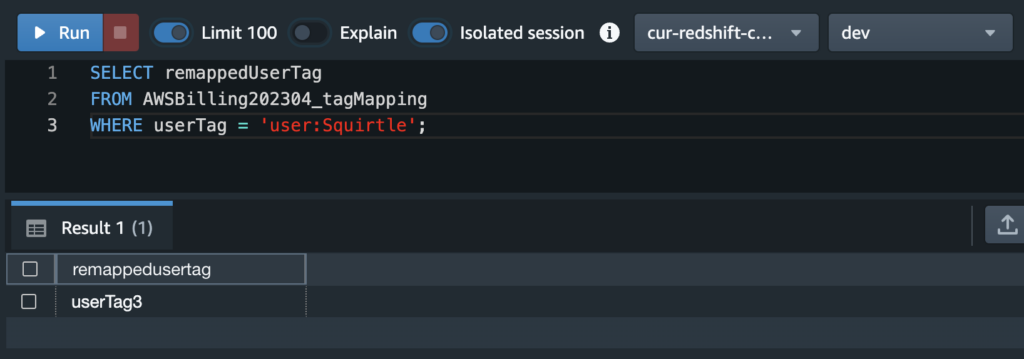
In the result, we can see it’s userTag3. Then, we can write the following query to find out data store related costs for the Squirtle app:
SELECT lineitem_productcode, userTag3, SUM(cast(lineitem_unblendedcost as float)) as cost
FROM AWSBilling202304
WHERE userTag3=’Data store’
GROUP BY lineitem_productcode, userTag3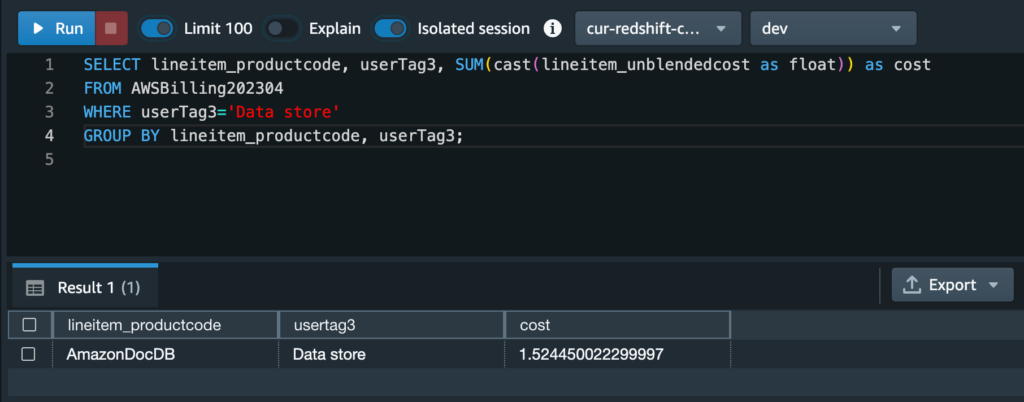
Conclusion
There you have it folks–a complete guide on integrating your CUR report with Redshift. It’s a bit involved, but luckily the Redshift manifest files take care of a lot of the setup for us. Once your CUR files are loaded into Redshift, you can use regular SQL queries to analyze them, giving you better insight into your AWS spend.
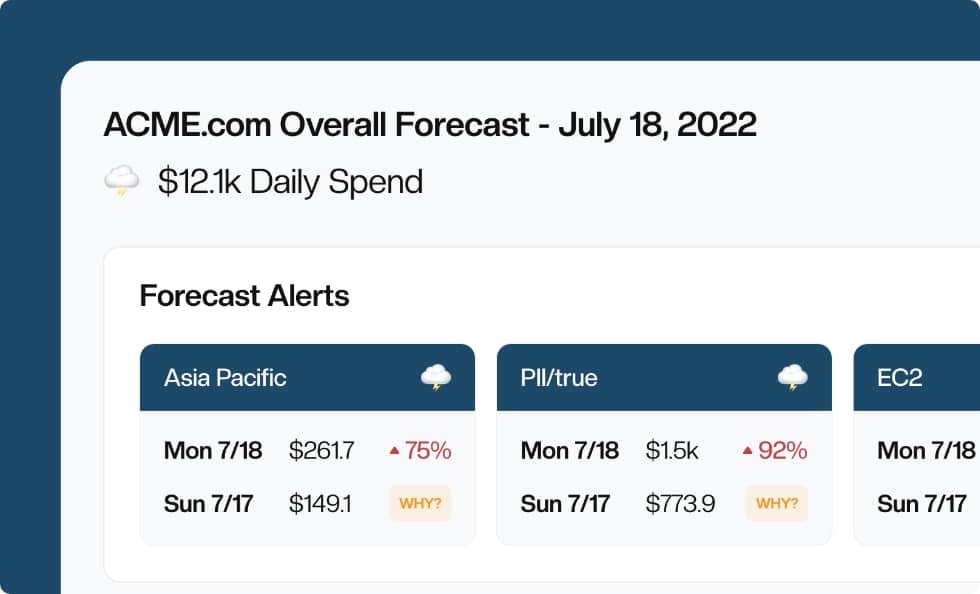
There’s many ways you can take this integration further, such as combining your CUR data with other enterprise data to perform large-scale analyses across multiple datasets. Another idea is to ditch the data warehouse setup and opt for a more lightweight approach with CloudForecast’s Cost Monitoring tool. This tool delivers daily spending reports directly to your team… and you won’t have to write a single SQL query again!
Manage, track, and report your AWS spending in seconds — not hours
CloudForecast’s focused daily AWS cost monitoring reports to help busy engineering teams understand their AWS costs, rapidly respond to any overspends, and promote opportunities to save costs.
Monitor & Manage AWS Cost in Seconds — Not Hours
CloudForecast makes the tedious work of AWS cost monitoring less tedious.
AWS cost management is easy with CloudForecast
We would love to learn more about the problems you are facing around AWS cost. Connect with us directly and we’ll schedule a time to chat!
