AWS Cost Detective Tool: An Easier Way to Investigate AWS Costs
Over the past few weeks, a collaborative effort between Fernando, Francois, and Arturo have resulted in the creation of a new feature: the “AWS Cost Detective Tool.” This new feature is now accessible to all of our customers on the current Enterprise plan.
While our “Daily AWS Cost Reports”, “Why? Links” for any cost increases, and “Monthly AWS CFO Reports” provide helpful insights for identifying potential increases in AWS costs, our users have expressed a desire for more detailed analyses of their AWS resources and more effective tools for AWS cost investigation exercises.
Fortunately, the newly developed AWS Cost Detective Tool can give users fast and accurate answers to their queries about possible AWS cost increases and trends. Here are some ways in which this tool can be beneficial.
TL;DR:
- We launched a new feature. Yay!
- With filters, users can get quick answers on new resources launched, resources trending upwards in cost, or the most expensive resources.
- Each investigation link is shareable.
- Only available for current Enterprise Plan
Start with Filters!
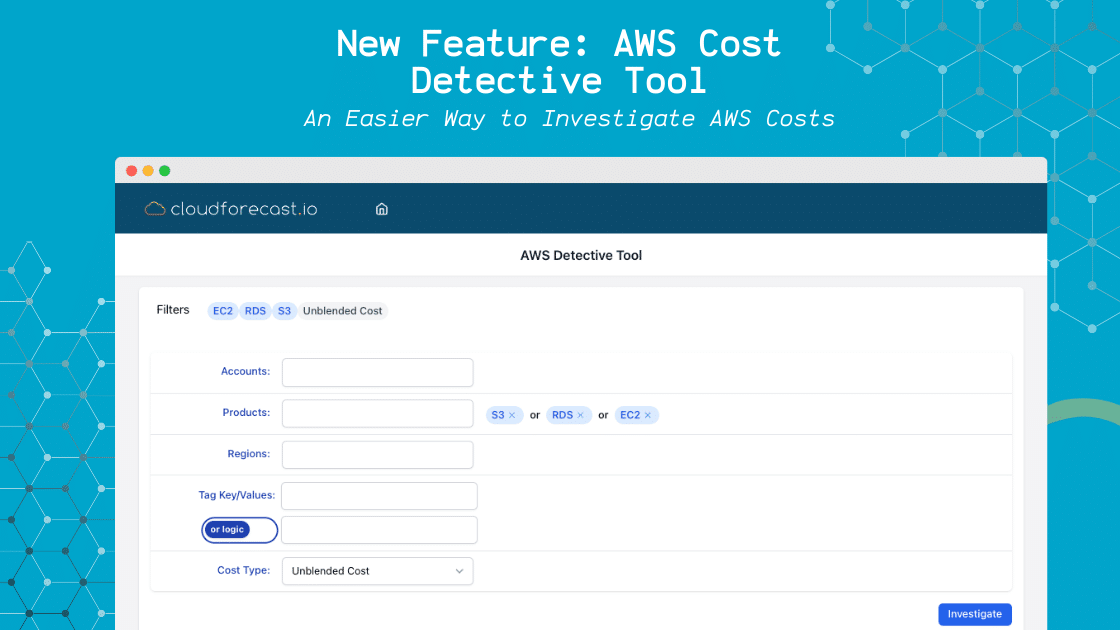
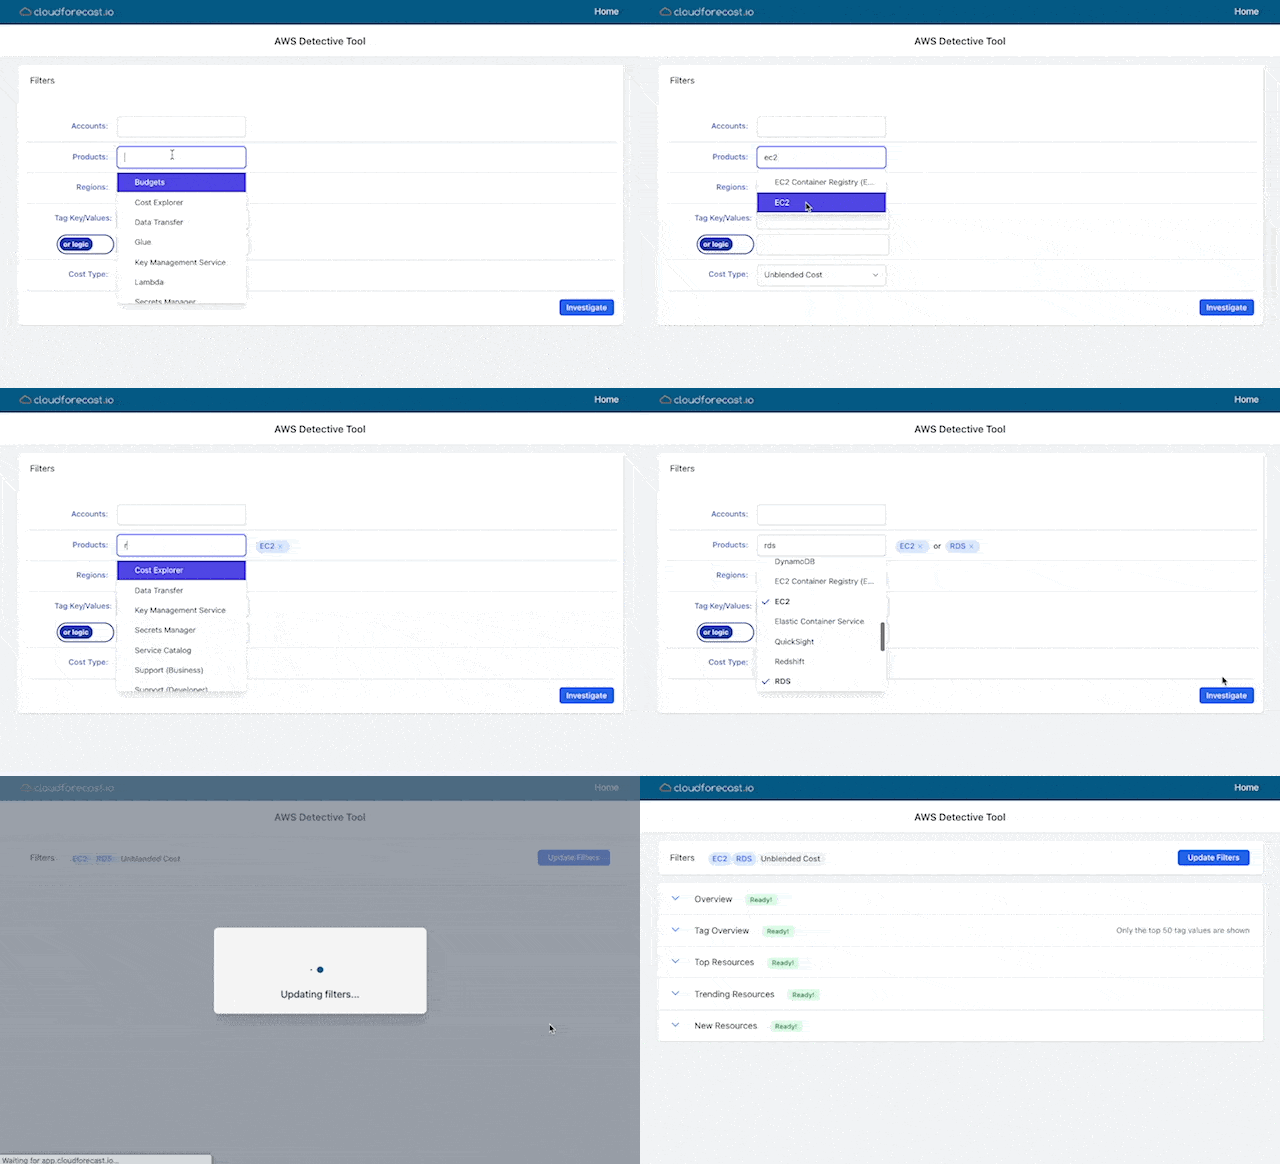
With the AWS Cost Detective Tool, users will start with a set of filters to help start the AWS cost investigation process. Possible starting points and scenarios:
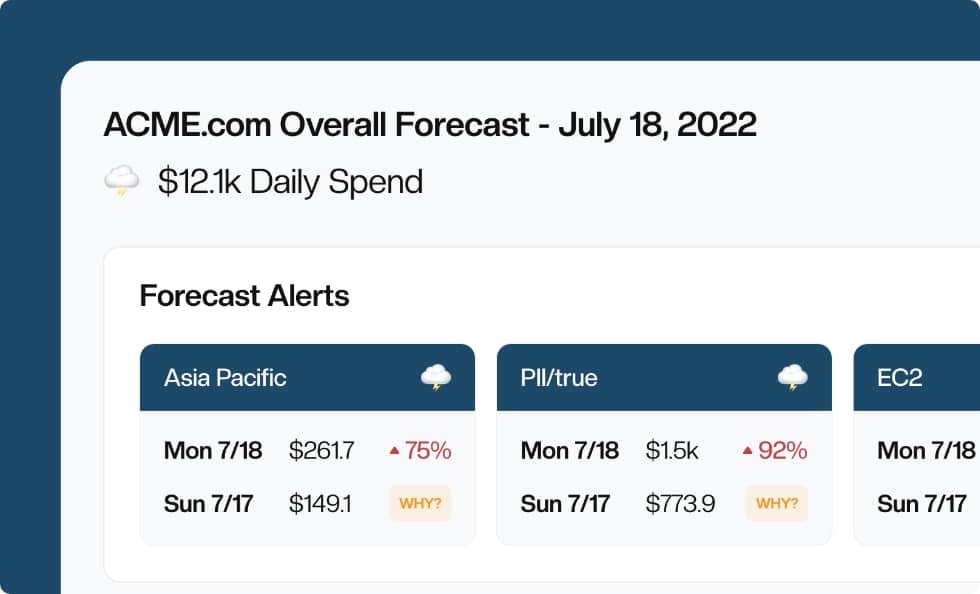
- A significant cost increase with an AWS service in a Forecast Alert from the Daily AWS Cost Monitoring Report
- The CFO or finance team is asking you why EC2 cost has been trending upwards in the Monthly Financial Report the past month.
- There is a specific tag key or tag value from a project you’re tasked with managing costs, and you want to see all the most expensive resources associated.
With any of those three use cases, we provide the following filters: Accounts, Product/Services, Regions, and Tag Key/Value.
Whatever the use case is, users can now enter that information through the filters provided, press Investigate, and the AWS Cost Detective Tool will provide focused answers to help users quickly understand potential cost increases from different angles:
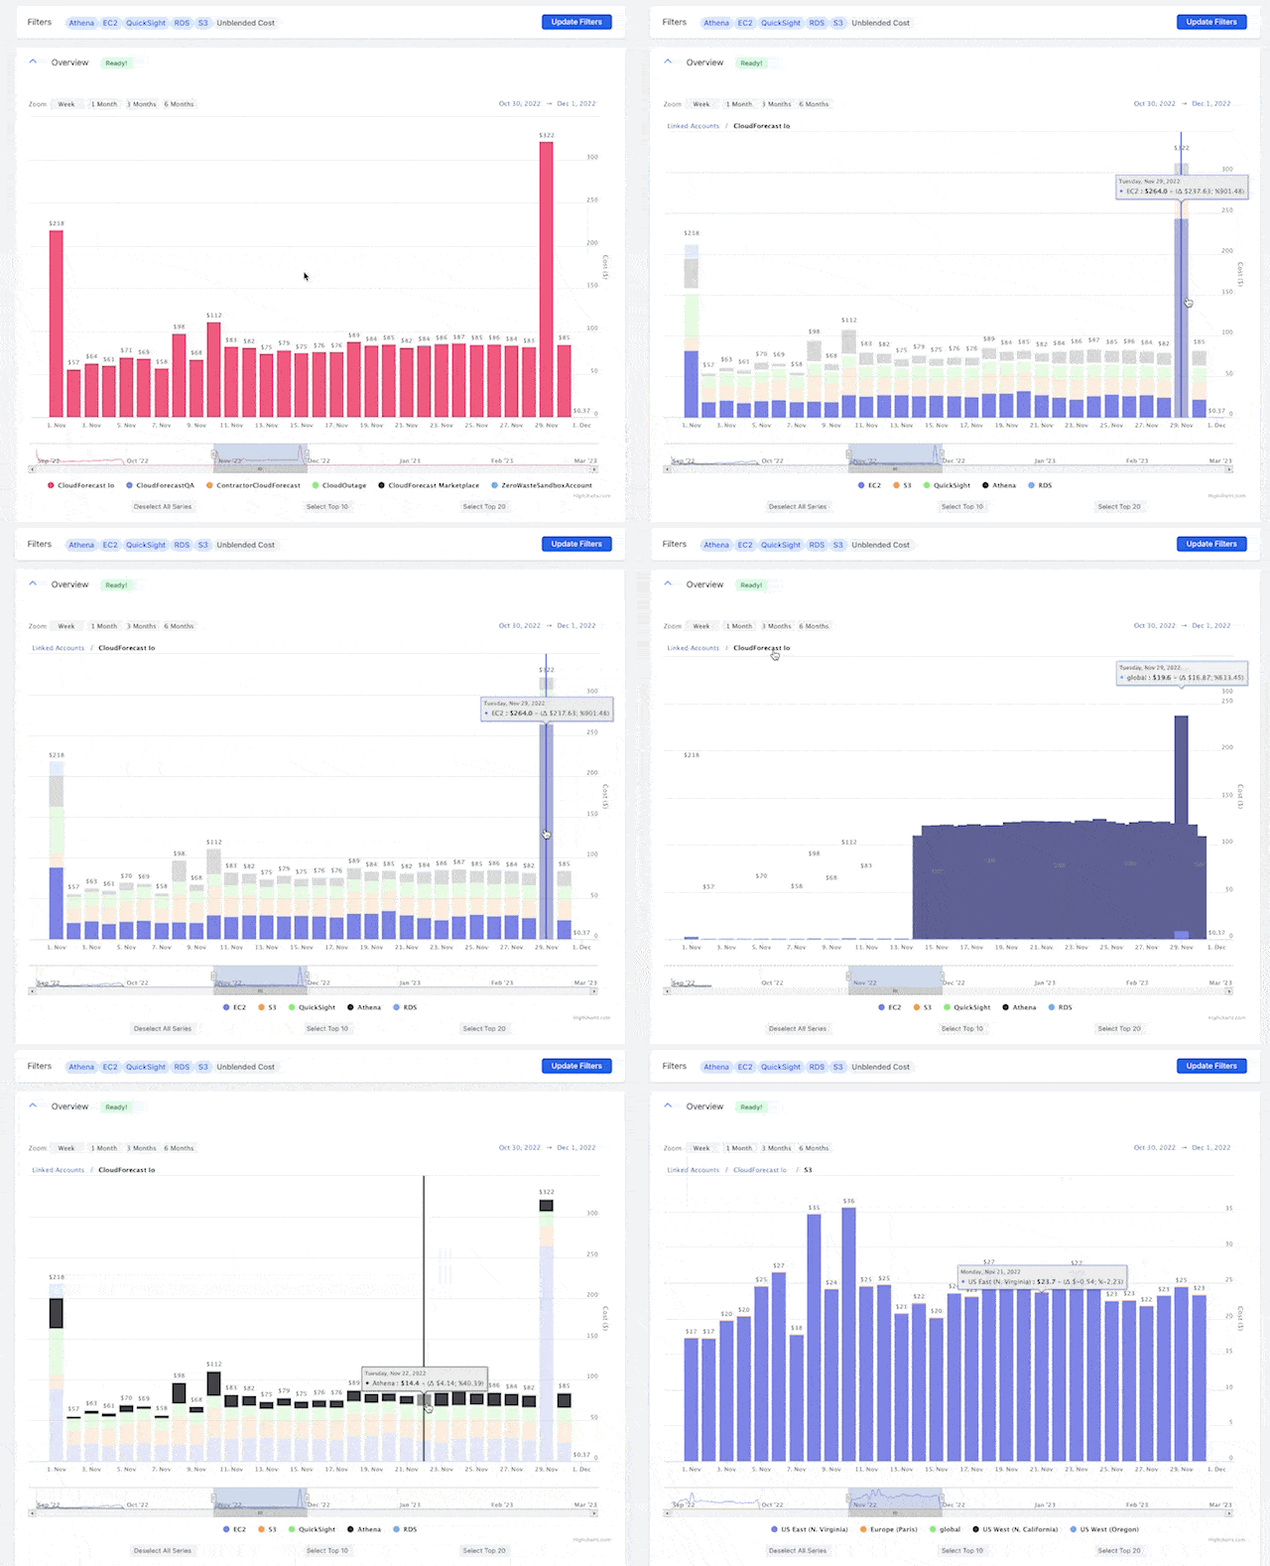
Overview Chart
This table provides an interactive stacked bar chart where users can drill down and see trends from the inputs. Users can then drill down into the stack bar charts in the following order: sub-accounts -> AWS Product/Services -> Regions:
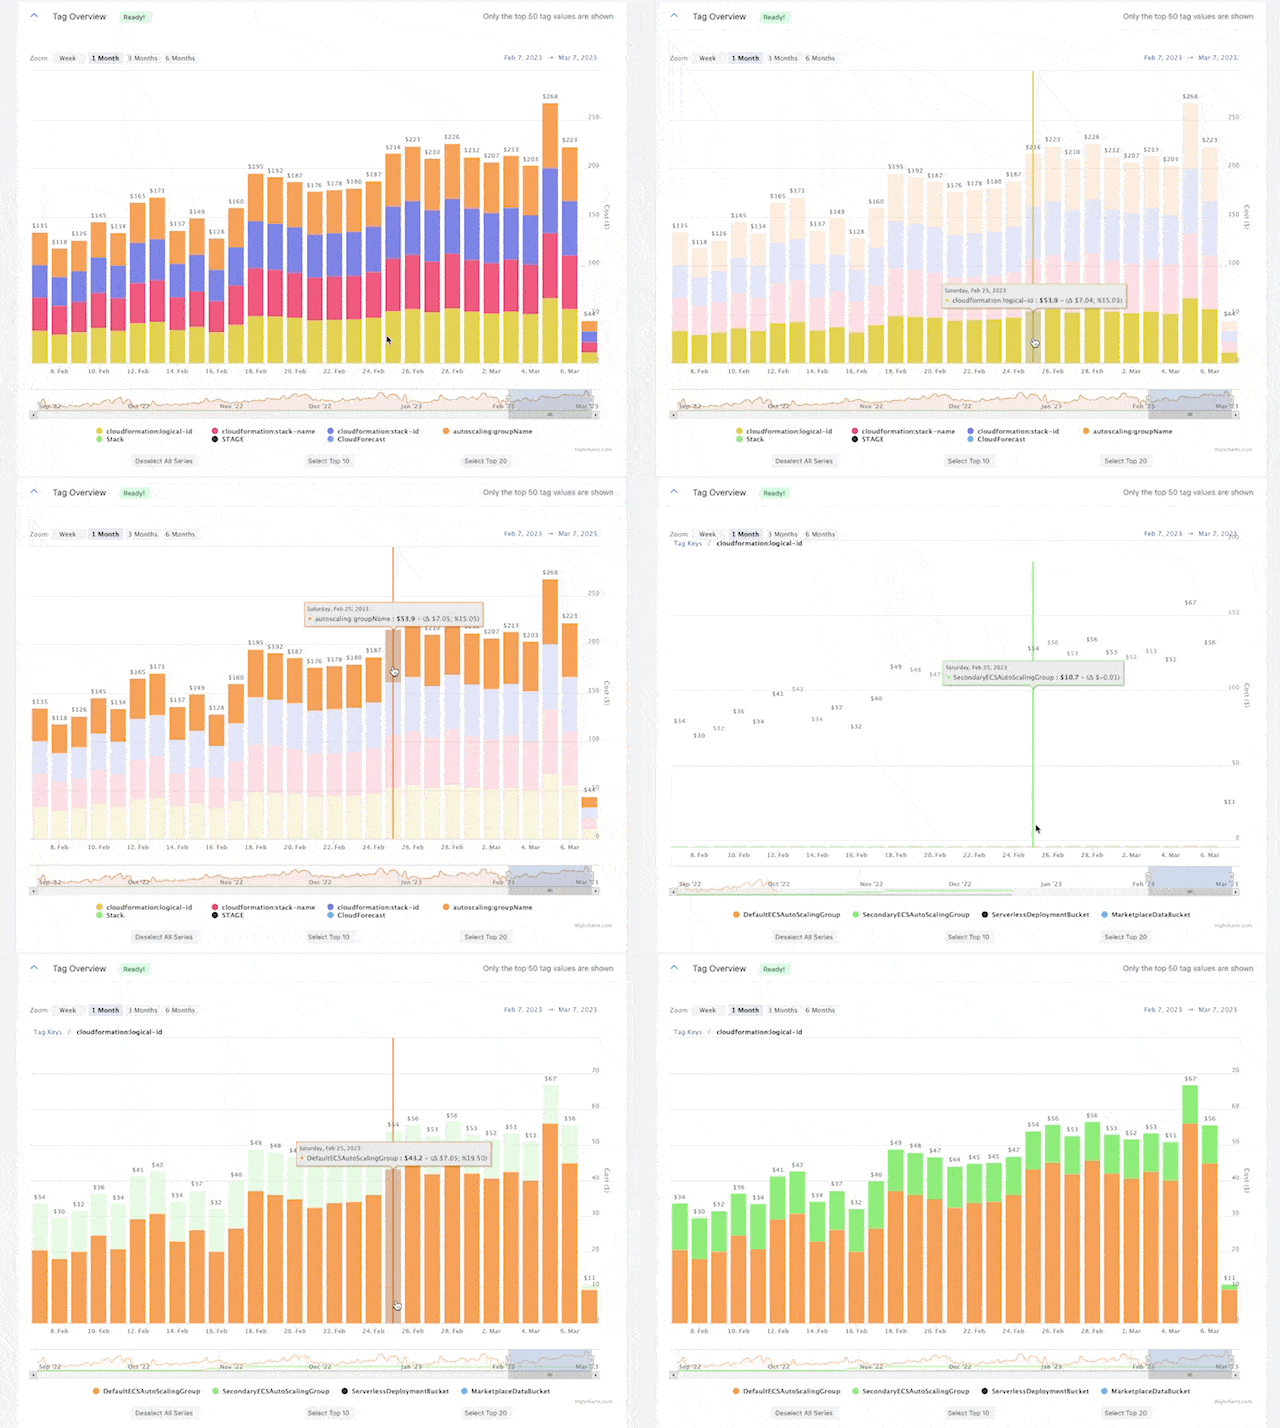
AWS Tags Overview
Like the Overview charts, the AWS Tag Overview drill-down starting point is from any Tag Key or Value associated with the filters.
If users have AWS resources tagged properly, this is a great way to visualize costs by tags and see trends. Users can drill down from Tag Key into a Tag Value.
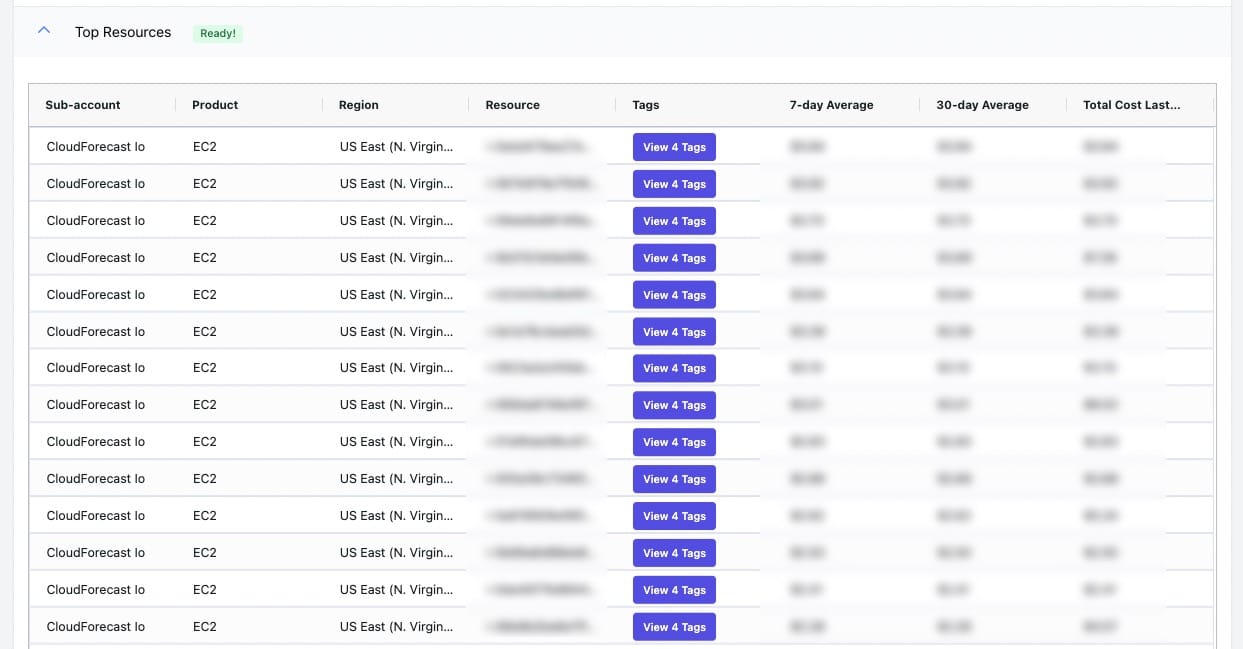
Top AWS Resources
The Top Resources table will display all the most expensive resources over the past three months. This table is sorted by descending order by the last 7-day average costs.
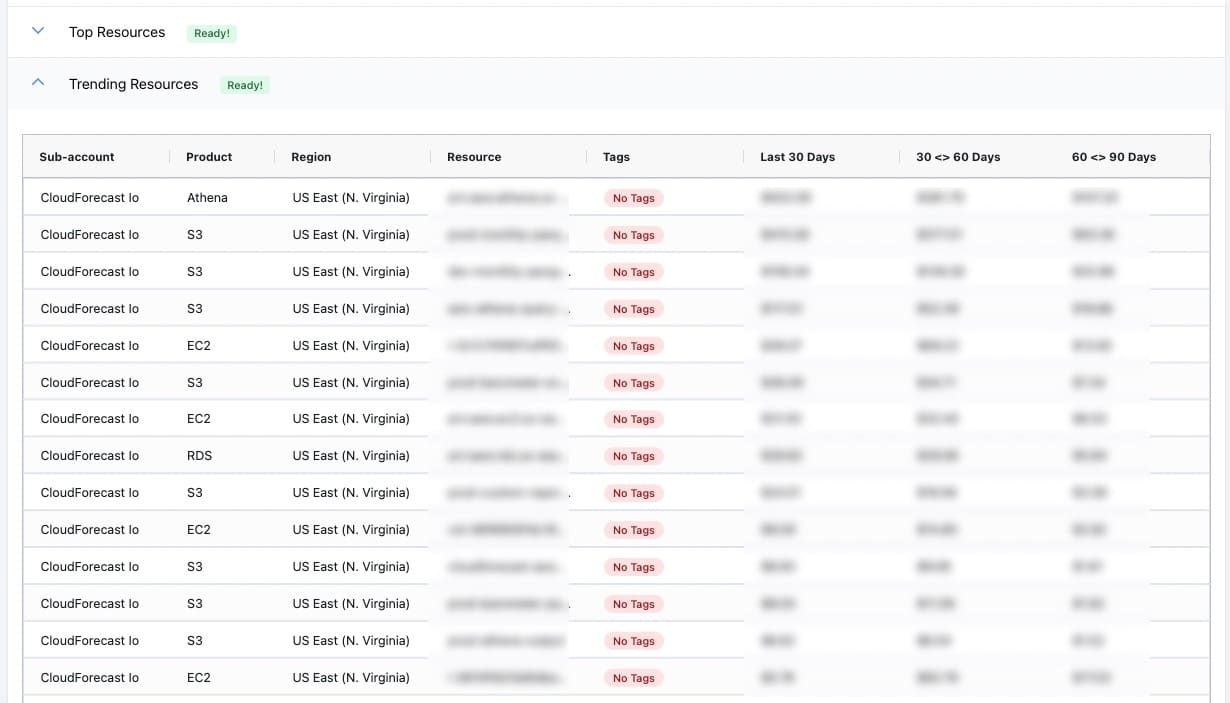
Trending AWS Resources
The Trending Resources table will display all AWS resources trending in costs over the last 90 days. Three key metrics help us define “Trending Resources”:
- Last 30 Days – How much did this resource cost the last 30 days
- 30–60 Days – How much did this resource cost between 30 and 60 days ago
- 60–90 Days – How much did this resource cost between 60 and 90 days ago
If a resource shows a significant cost increase from 60–90 days ago vs 0–60 days, those resources will be surfaced in this table.
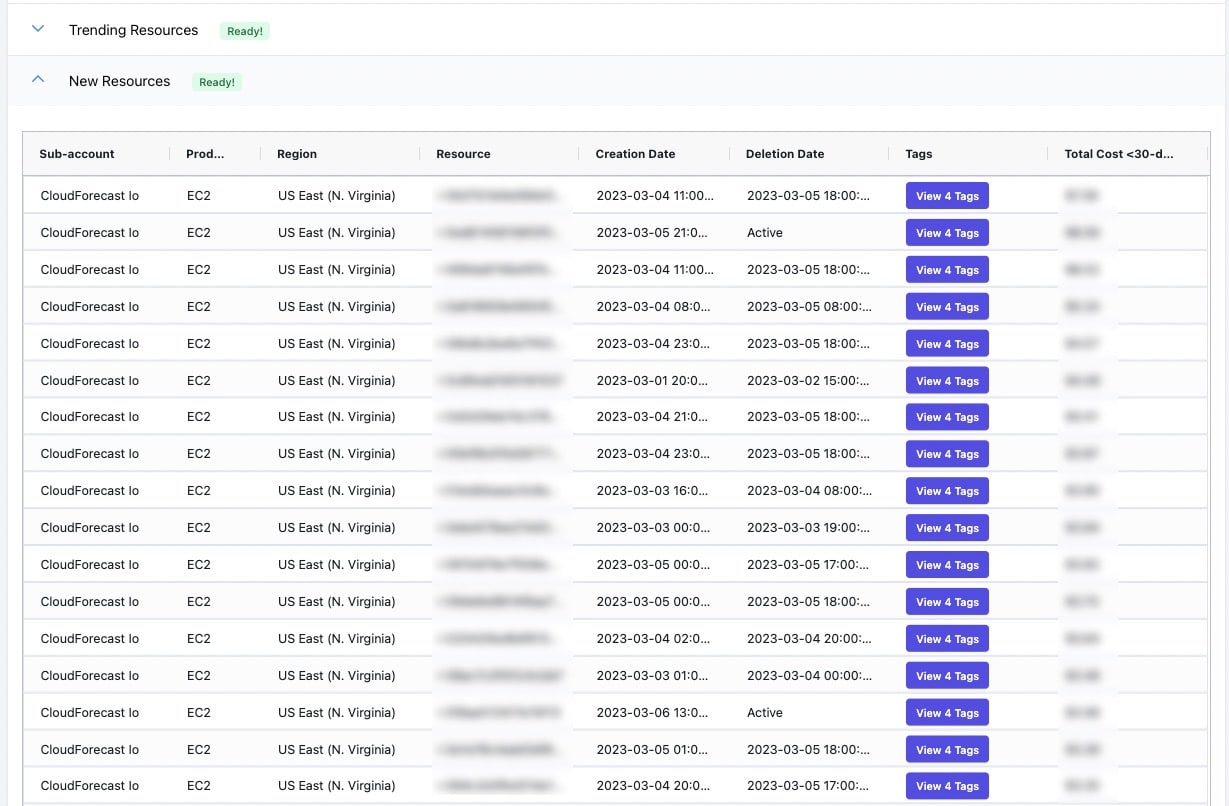
New AWS Resources
This table will surface all the new resources created in the last 30 days and let users know when they were created and if they are still active or deleted:
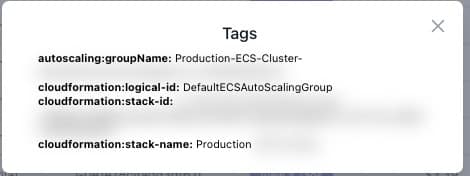
View Tags Button
If the resources are tagged, users can quickly view the Tag Keys and values associated with the AWS resources in the Top Resources, Trending Resources, and New Resource tables:
Shareable Links
After applying the filters and pressing the investigate button, users can copy the URL from the browser and share it internally—the strings in the URL correlate directly back to the filters.
Conclusion
We know our users are a bunch of busy bees, mainly engineers, SREs, DevOps, and tech leads who are always occupied with challenging technical problems. We get it; time is precious, and you don’t want to spend it fretting over AWS costs.
That’s why our new feature, the “AWS Cost Detective Tool,” is here to save the day. This powerful tool will give users quick and straightforward answers to all your frequently asked AWS cost questions without causing any disruption to their busy schedules.
This new feature is the perfect starting point for any AWS cost investigation within their organization. It might be even better to use this over AWS Cost Explorer when you need to do a deeper dive into resources.
We want to know what you think, so don’t hesitate to give us your feedback on how we can make it even better: [email protected]
Manage, track, and report your AWS spending in seconds — not hours
CloudForecast’s focused daily AWS cost monitoring reports to help busy engineering teams understand their AWS costs, rapidly respond to any overspends, and promote opportunities to save costs.
Monitor & Manage AWS Cost in Seconds — Not Hours
CloudForecast makes the tedious work of AWS cost monitoring less tedious.
AWS cost management is easy with CloudForecast
We would love to learn more about the problems you are facing around AWS cost. Connect with us directly and we’ll schedule a time to chat!
