Using Amazon QuickSight With Cost and Usage Reports (CUR)
In the Ultimate Guide to the AWS Cost and Usage Report (CUR), we introduced the most powerful and insightful tool to help you understand your AWS costs. The CUR is a detailed report that breaks down everything you could possibly want to know about cost and usage metrics. If you haven’t done so already, enable the CUR in your account. It’s a no-brainer.
But enabling the CUR is just the first step. On its own, the CUR is just a monster spreadsheet with too much data for a human to know what to do with. It’s a classic case of having all the spending data you want at your disposal, but lacking the proper tools to make meaningful sense of it.
That is, until Amazon QuickSight. The CUR integrates natively with QuickSight, allowing you to create beautiful visualizations of your spending data in minutes. It’s surprisingly simple to set up this integration, and you don’t have to be a QuickSight expert to get a ton of value. In this article, we’ll show you how to set up your CUR with QuickSight, and some of the basic but powerful visualizations you can create.
What is Amazon QuickSight?
Amazon QuickSight is a cloud-based business intelligence (BI) tool. Its main function is to help you create visualizations and dashboards. No specific domain knowledge required–QuickSight’s drag-and-drop interface makes it easy for anyone to immediately start producing interactive graphs.
Compared to integrating the CUR with Athena, QuickSight is easier to onboard with for technical and non-technical users alike, since SQL knowledge isn’t required. If producing cost visualizations and reports is your main aim, the QuickSight integration should get you there the fastest. However, we do have to admit that you’re probably better off considering an Athena or Redshift integration for more complex analyses.
Step-By-Step: How To Integrate Your CUR With Amazon QuickSight
It literally only takes a few clicks to integrate your CUR with QuickSight. To start, navigate to the Billing console. Whether you have yet to enable the CUR or have an existing CUR already, ensure that Report data integration is set up to Amazon QuickSight:
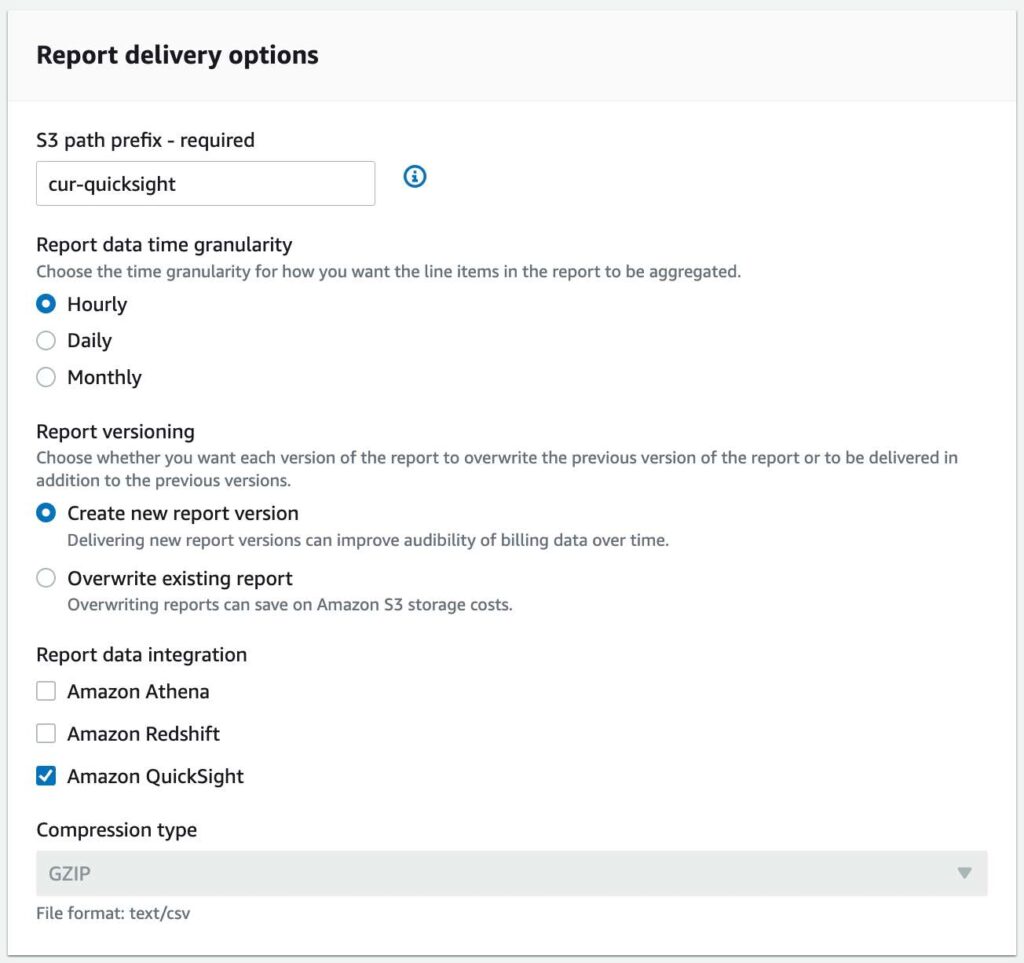
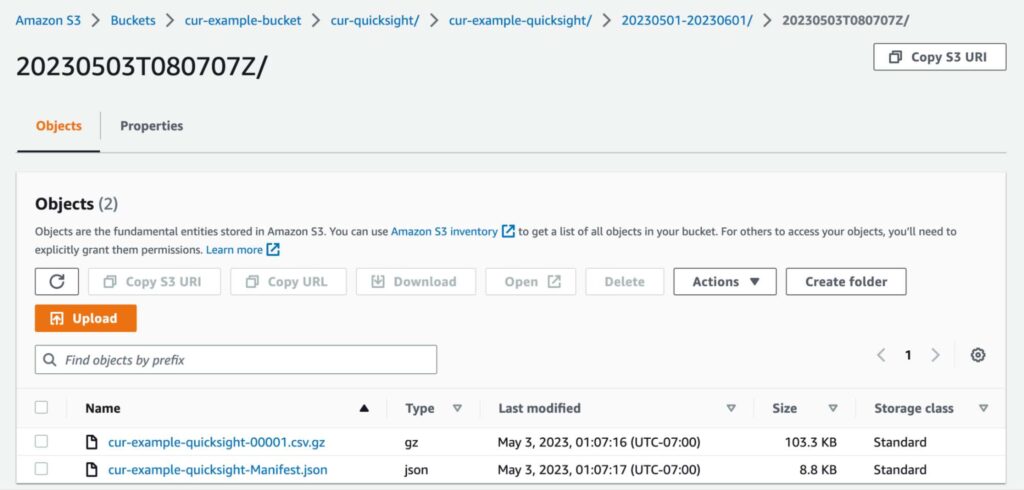
When you pick QuickSight as your integration, AWS automatically uses the CSV format for your CUR files, and compresses them using GZIP. In addition, you’ll find a QuickSight Manifest file alongside each CUR report. Check that both of these files are in the S3 bucket you specified for your CUR report (Note that it can take up to 24 hours for AWS to deliver your first report):
For each month of data, QuickSight also produces a single Manifest file under the QuickSight/ path. These files are very important, as you’ll need them when connecting QuickSight to your CUR data:
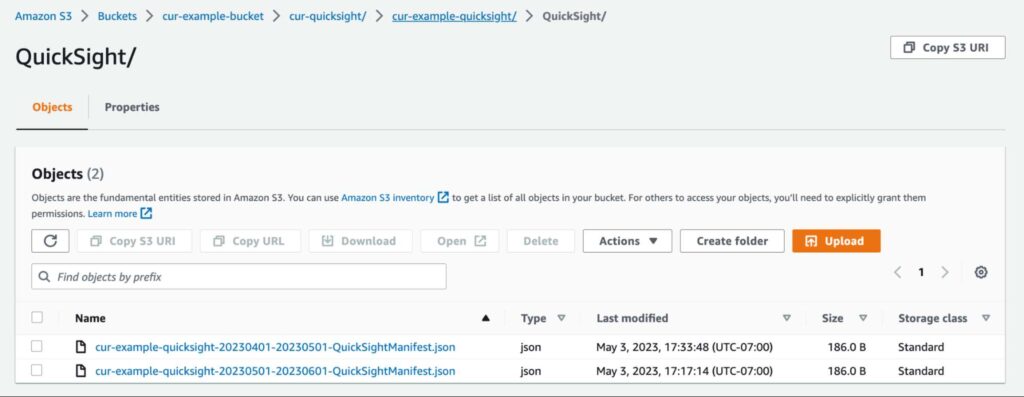
You can’t proceed until you see all these files in your S3 bucket! Don’t worry, we’ll wait–this guide isn’t going anywhere.
Ingesting Your CUR Into Quicksight
Once your CUR is set up properly, we can move into QuickSight.
First, make sure QuickSight has permissions to access the S3 bucket containing your CUR files. To do this, navigate to the QuickSight console. Click on your profile icon in the top right corner, choose Manage QuickSight, and then Security & permissions in the left menu. Under QuickSight access to AWS services, choose Manage:
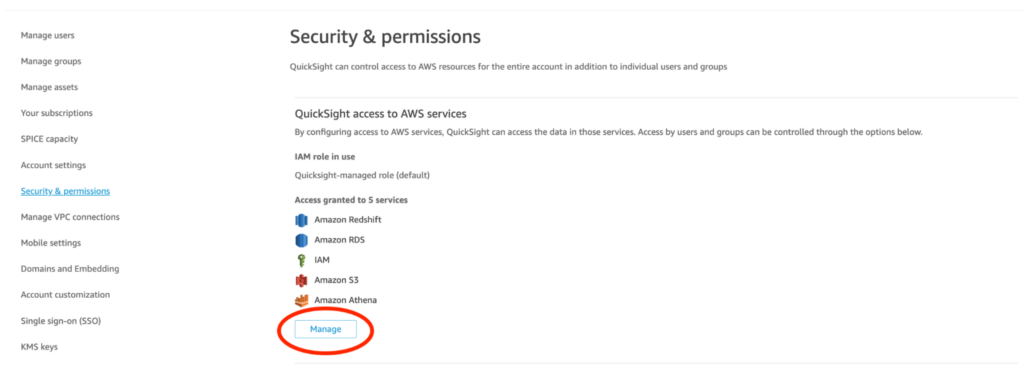
By default, you should see that the Amazon S3 box is already checked–if it isn’t, check it. Then, click on Select S3 buckets and ensure that your CUR bucket is selected as well. Choose Finish, then Save.
Finally, we’re ready to ingest our CUR report into QuickSight! From the QuickSight console, choose New analysis, followed by New dataset. Under Create a Dataset, choose S3. This will prompt you for a data source name, as well as the QuickSight manifest file URL:
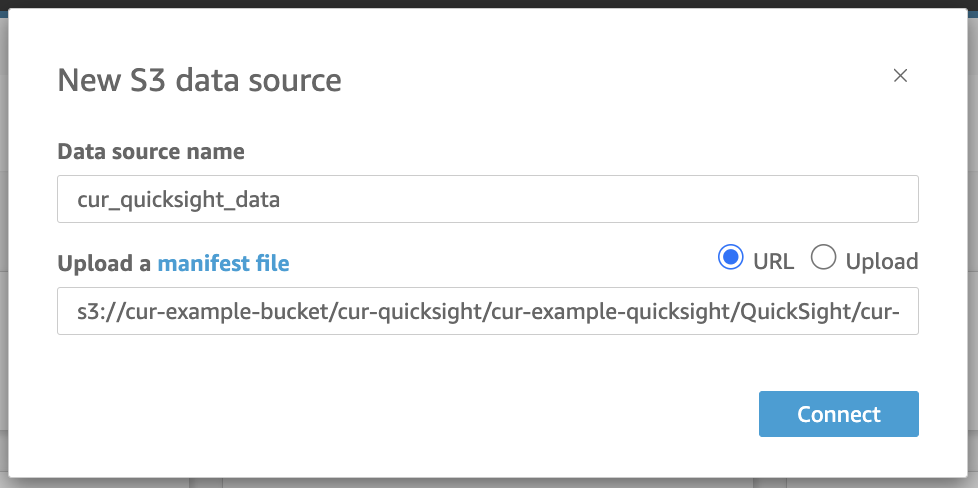
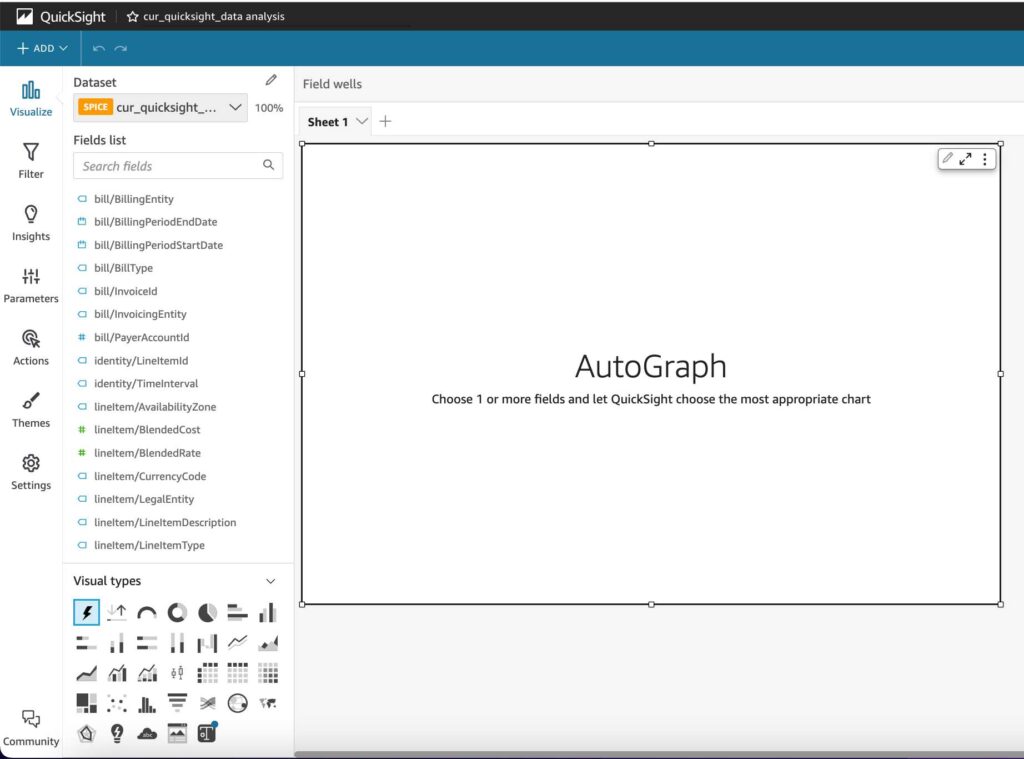
Choose Connect, and QuickSight should successfully connect to your S3 CUR data. In the next panel, you have the option of previewing the data and unselecting or renaming fields if you want by clicking on Edit/Preview data. Otherwise, choose Visualize to complete the entire setup and start tinkering with QuickSight.
Creating Visualizations of Your AWS Spending Using Quicksight
So now all your data is in, but you’re staring at a blank QuickSight canvas… need some inspiration to get started? In this section, we’ll explore two common graphs you might choose to create and analyze depending on your AWS usage patterns.
Bar Graph
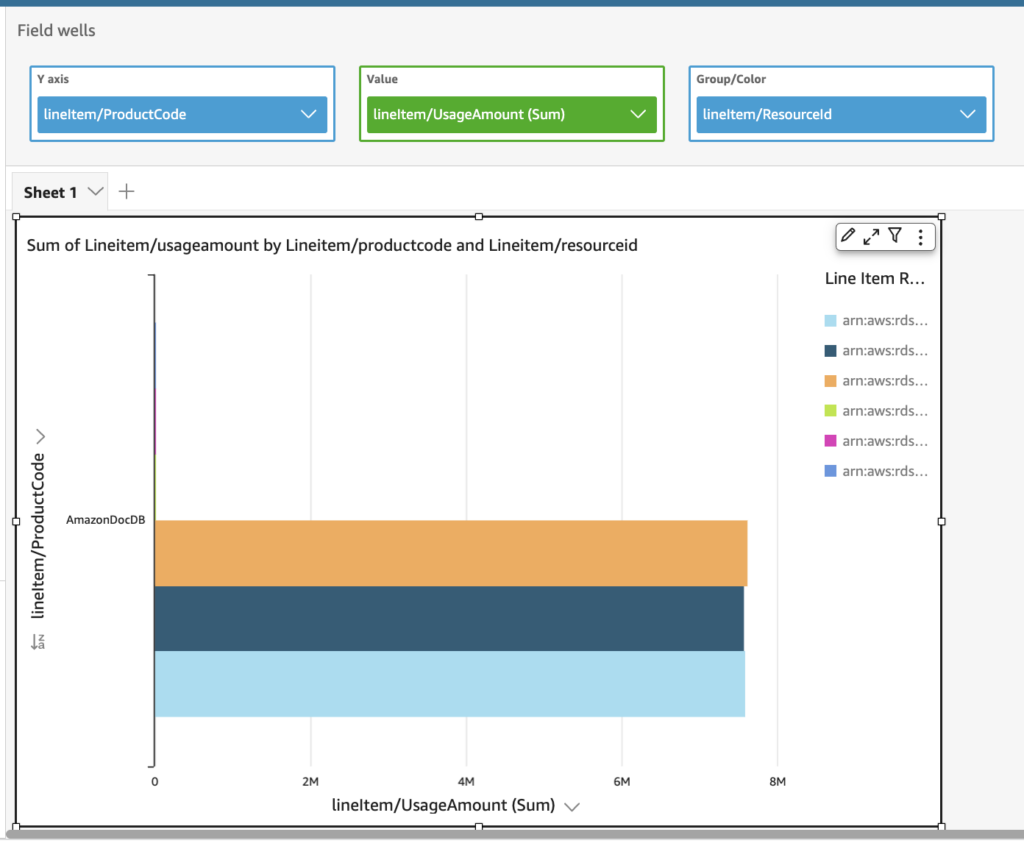
QuickSight supports a plethora of different visual types out of the box. This can be a positive thing as it gives you freedom of choice, but it can also be intimidating if you aren’t sure which best represents your data. Luckily, QuickSight has an AutoGraph feature where you can select fields and let QuickSight do its thing. For instance, if you search for and choose the lineitem/ProductCode and lineItem/UsageAmount fields, AutoGraph goes ahead and auto-magically produces a bar graph:
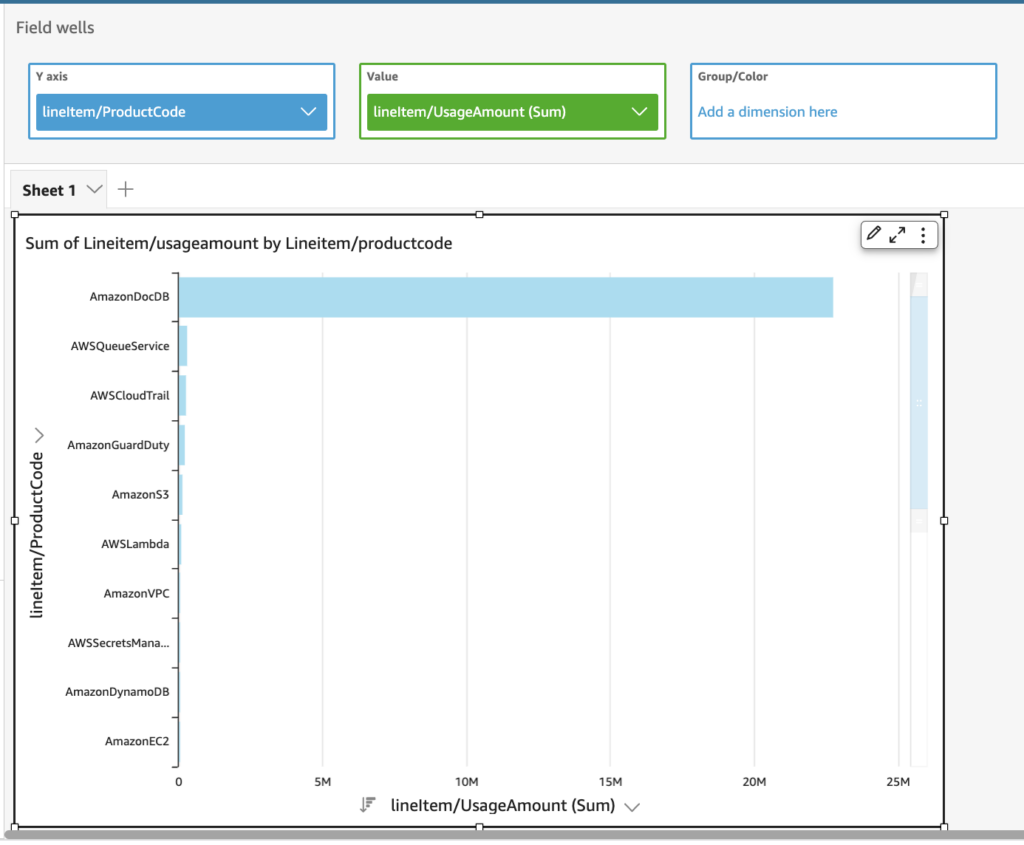
The nice thing about QuickSight is that everything is interactive. For instance, since the majority of my usage comes from Amazon DocumentDB, I can right-click on that bar and focus exclusively on that large segment. Then, if I select the lineItem/ResourceId field, I can then see a breakdown of the Amazon Resource Names (ARNs) that contribute most to usage:
Pie Chart
Bar graphs are good for seeing values. If you care less about values and more about percentage distributions, your other best visualization friend is the pie chart. One great use case for a pie chart is to gain insight into how costs are distributed over different services or resources. For example, still focusing on DocumentDB, we can take a choose the lineItem/ResourceId and lineItem/UnblendedCost fields to create a pie chart as follows:
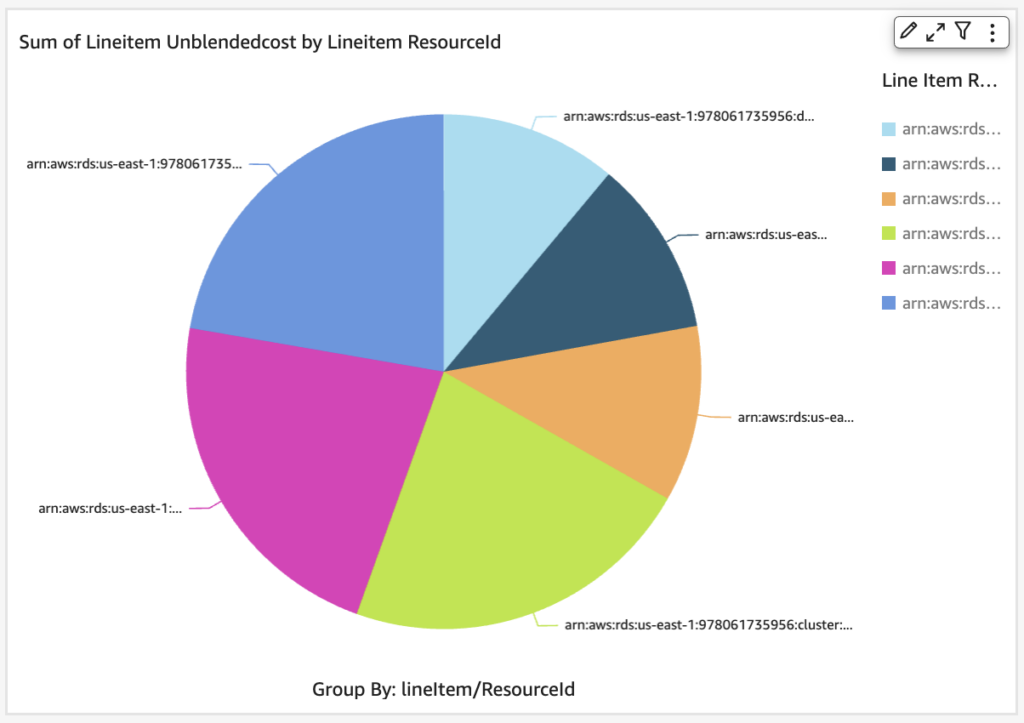
Note that pie charts in QuickSight mask the actual values, since all we want to focus on here is the percentage distribution. If you care about the actual values, you can still view them by clicking on the three dots in the top right corner, followed by View summary data.
Optimization: EC2 On-Demand vs. Reserved
Yes, there are a bunch more graph types in QuickSight. But you don’t have to venture into the complicated ones to figure out how to optimize your AWS usage! To prove it to you, consider the following multi-bar graph, which shows EC2 usage types per instance type (taken from this AWS video):
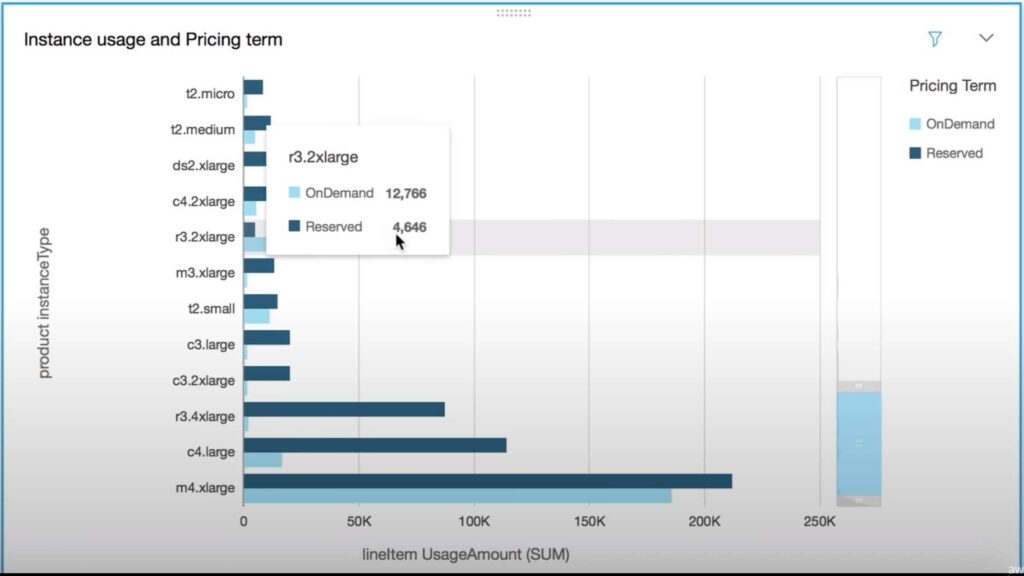
To create this graph, we used the product/instanceType (y-axis), lineItem/UsageAmount (Value), and pricing/term (Group/Color) fields. Based on the fact that OnDemand EC2 instances are more expensive than Reserved ones, we want to find instance types where we could potentially save by using more Reserved instances. With this graph, we’re able to easily identify that our r3.2xlarge instances are one such culprit. It took less than a minute to figure that out, and we didn’t need to use complicated graph types.
Conclusion
Overall, taking advantage of this native CUR integration with QuickSight is one of the easiest ways to visualize your spending and usage. With QuickSight, there’s no need to debug complicated SQL queries. It’s super easy to allow QuickSight to access your S3 CUR data, and boom! You’re creating awesome visualizations in minutes, all with QuickSight’s drag-and-drop interface.
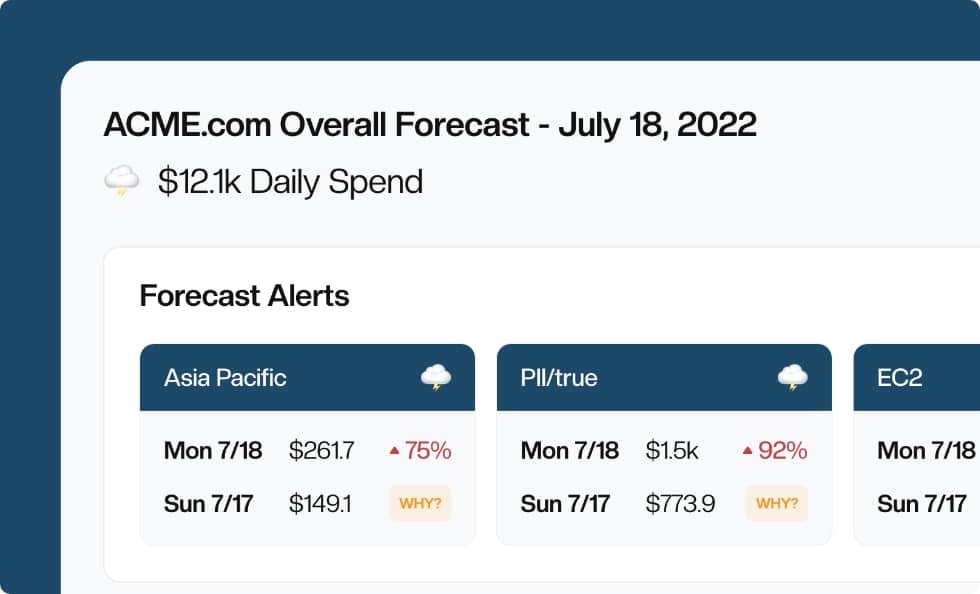
Of course, the next step after that is to figure out which graphs are most relevant for you to create and report on. That requires you to know your way around the CUR data dictionary, and make sure you’re choosing the right fields and graph types. If you want to remove all that extra hassle, consider CloudForecast’s Cost Monitoring tool, which can automatically deliver daily spending reports directly to your team.
Manage, track, and report your AWS spending in seconds — not hours
CloudForecast’s focused daily AWS cost monitoring reports to help busy engineering teams understand their AWS costs, rapidly respond to any overspends, and promote opportunities to save costs.
Monitor & Manage AWS Cost in Seconds — Not Hours
CloudForecast makes the tedious work of AWS cost monitoring less tedious.
AWS cost management is easy with CloudForecast
We would love to learn more about the problems you are facing around AWS cost. Connect with us directly and we’ll schedule a time to chat!
